How to Choose Polyol for PU Insulation?
Choosing Polyol For Pu Insulation is a technical decision with measurable energy, safety, and durability consequences. The UNEP Global Status Report for Buildings and Construction 2023 reported that buildings consumed 34% of global energy demand in 2022. The sector also produced 37% of energy and process-related carbon emissions. These figures explain why insulation chemistry deserves careful attention. A small change in foam performance can affect heating loads, equipment size, and long-term operating costs.
The right polyol system must match the application, process, and climate. Key factors include hydroxyl value, viscosity, water content, catalyst response, flame-retardant design, and compatibility with the blowing agent. For rigid polyurethane panels, lower thermal conductivity is important. However, initial conductivity alone is not enough. Dimensional stability, closed-cell content, moisture resistance, and adhesion should also be verified. Standards such as EN 13165 and ASTM C518 support consistent product testing, but laboratory results cannot represent every installation. That is a common weakness.
Field conditions matter.
A formulation may perform well in a controlled test and behave differently on a cold production line. Temperature, mixing accuracy, mold pressure, and curing time can shift foam density and cell structure. The IEA’s Energy Efficiency 2023 report also emphasizes that building efficiency depends on both materials and real-world implementation. Therefore, buyers should request technical data sheets, safety documentation, aging results, and batch-control records. Suppliers with practical application experience should explain trade-offs clearly, not promise one universal solution. This guide examines how to compare polyols, interpret performance data, and select a system that balances insulation value, process reliability, regulatory expectations, and lifecycle impact. Some decisions remain imperfect. Good engineering makes those uncertainties visible.
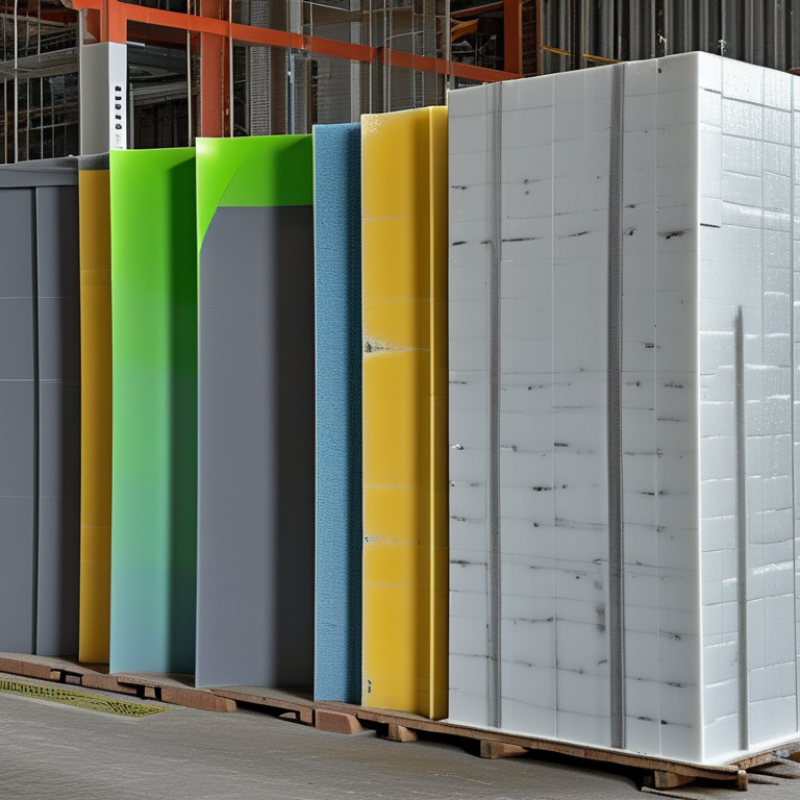
Define Insulation Targets: Aim for 0.020–0.028 W/m·K Thermal Conductivity
How to Choose Polyol for PU Insulation?
Choosing a polyol for PU insulation starts with a clear thermal target. Aim for 0.020–0.028 W/m·K thermal conductivity. This range demands more than a low-viscosity raw material. The polyol must help form small, uniform, and closed cells. In practical formulation work, monitor cream time, rise profile, flow, and cured density. A few seconds of mixing variation can change the foam structure.
Polyol functionality, hydroxyl value, and viscosity influence crosslinking and cell stability. Higher functionality may improve dimensional strength, but excessive rigidity can reduce processability. The catalyst package, isocyanate index, water level, and physical blowing system also affect conductivity. Keep these variables controlled. Measure samples at a defined temperature and humidity, because moisture can distort results. Test both fresh foam and aged foam.
A useful trial uses several polyol ratios rather than one fixed recipe. Record density, cell appearance, compressive strength, and conductivity together. A foam showing 0.021 W/m·K on day one may perform differently after aging. That is the uncomfortable detail. Laboratory results do not always predict factory behavior. Uneven mixing, cold molds, or poor panel sealing can raise heat transfer noticeably. Review failed samples honestly, even when the formulation looks correct on paper.
Verify Processing Performance: Check 10–30 Seconds Cream-to-Rise Reaction Time
Choosing a polyol for PU insulation requires more than comparing density or thermal conductivity. Processing behavior often reveals whether a formulation fits your equipment. Measure the cream-to-rise reaction time carefully. A practical target is 10–30 seconds under controlled conditions. This window gives operators enough time to mix, pour, and position the material before expansion becomes difficult to manage.
Use a calibrated cup test before production trials. Record polyol temperature, ambient temperature, mixing speed, cream time, rise time, tack-free time, and final foam density. Keep the isocyanate index and water level consistent. A polyol blend that rises too quickly may cause poor filling, voids, or uneven cell structure. A slower system may improve flow, but it can increase cycle time. Small temperature changes matter. Even a few degrees can shift the reaction noticeably.
Machine trials remain essential. Check flow distance, mold filling, surface quality, dimensional stability, and adhesion after curing. Do not judge the polyol from one test alone. A clean 20-second result can still mislead when the production line behaves differently. I have seen laboratory cups look excellent while larger panels developed edge shrinkage. That gap deserves investigation. Review catalyst balance, surfactant selection, viscosity, and mixing efficiency before changing the polyol. The best choice is the one that delivers a stable reaction window across realistic operating conditions.
How to Choose Polyol for PU Insulation? - Verify Processing Performance: Check 10–30 Seconds Cream-to-Rise Reaction Time
Reference guidance: A cream time of approximately 10–30 seconds is commonly used as a practical processing window for many rigid PU insulation systems. Actual values depend on the isocyanate index, catalyst package, blowing-agent system, component temperature, mixing energy, mold or substrate temperature, and equipment throughput. Confirm the final formulation through cup tests, free-rise density testing, dimensional-stability testing and production-line trials.
Validate Fire and Standards Compliance Under EN 13165 and ASTM C518
How to Choose Polyol for PU Insulation?
Polyol selection should begin with the required standard, not only the lowest thermal conductivity. Under EN 13165, rigid polyurethane insulation must demonstrate declared thermal performance, dimensional stability, and suitable reaction-to-fire classification. The polyol system affects cell structure, density, aging, and flame-retardant balance. A small formulation change can alter all four.
ASTM C518 measures heat flow through insulation using a heat-flow-meter apparatus. It does not provide a fire rating. This distinction is often missed. Select a polyol that supports stable lambda values after conditioning, then verify fire performance through the applicable fire-test route.
For European projects, EN 13501-1 classification commonly supports the fire assessment linked to EN 13165 products. For North American applications, separate tests may be required, depending on the assembly and code pathway.
Use measured data, not supplier claims alone. A competent laboratory should report specimen density, thickness, aging condition, mean temperature, and uncertainty beside the ASTM C518 result. The International Energy Agency reported that buildings consumed about 30% of global final energy in 2022, increasing pressure for durable insulation performance (IEA, Buildings 2023). Yet lower lambda is not automatically safer. No formulation is perfect. Flame retardants can influence viscosity, adhesion, and long-term cell stability. Review the full test record, repeat critical tests, and question results that appear unusually good.

 '
'
